Weighing Market or Electronic Scale Market in Vietnam

Thông tin chi tiết
WinMax Market Research - Vietnam can help you in many ways
- You can get most accurate and up-to-date market size, market share, and market knowlewdge from our experienced industry experts.
- You can monitor shipment details of your competitors from Vietnam shipment data and analyse their imports, exports and trading partners from real custom data
- You can determine factors for driving success in your import-export business
- Our WinMax Market Research also helps financial institutions, logistics companies and other businesses to find the best prospects
Content

1 - Headlines
• Electronic weighing scales find use across several applications such as retail, healthcare, veterinary, laboratories, jewelry, and other industrial applications. Among the various application segments in the electronic weighing scale market, the industrial scales segment (HS code: 8423) accounts for comparatively higher revenue share comparing to laboratories balance (HS code: 9016).
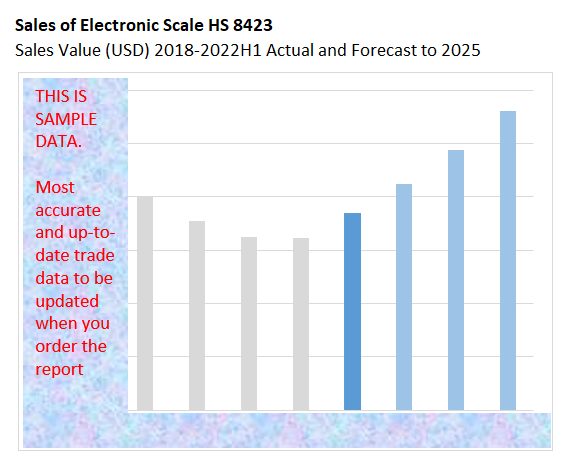
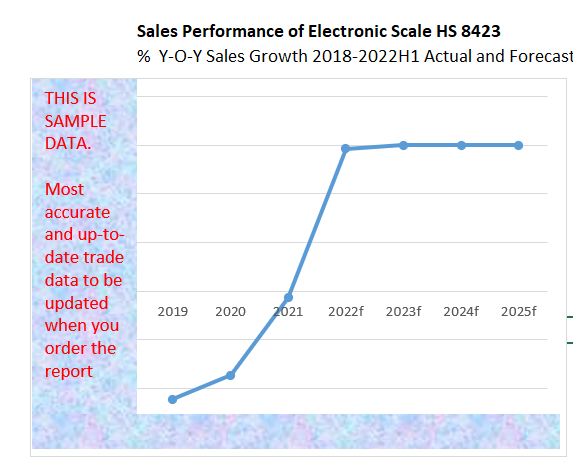
• In first half of 2022, weighing market increases by 12% in sales and 6% in total volume comparing to the same period last year. We estimated full year 2022 to reach xx million USD (15% growth vs last year)
• Weighing market declined in 2019(-11%), 2020 (-9%), and 2021 (-1%) due to covid-19 pandemic and ramped up in 2022H1 (12% growth)
• Over the forecast period, weighing market is projected to see a total sales value in full year 2022 growth at 15%. CAGR 2022-2025 of 15%, to reach xx million USD in 2025.
• This is highly competitive market where none of brand has market share more than 10%, there are more than 100 brands enter the market.
• A wide availability of low-cost sensors such as loadcell that are an important component of electronic weighing scales is a key factor boosting the revenue growth. Further, an increasing adoption of digital measuring technology and equipment across different industry verticals owing to features such as reliability, cost effectiveness, and enhanced productivity as compared to traditional analog weighing scales is augmenting demand and revenue growth of the electronic weighing scale market across the country.
2 - Prospects
In the eleven months of 2022, investment capital realized from the State budget was estimated at 74.9% of the year plan, up 19.9% over the same period last year. The implemented foreign direct investment capital in Vietnam in 11 months of 2022 was estimated at 19.68 billion USD, up 15.1% over the same period last year.
Realized investment capital from the State budget in November was estimated at 58.5 trillion VND, up 19.7% over the same period last year, including Centrally managed capital reached nearly 10.8 trillion VND, up 35.3%; local capital under management was 47.7 trillion VND, up 16.6%. In the eleven months of 2022, investment capital realized from the State budget was estimated at 445.9 trillion VND, equaling 74.9% of the year plan and increasing 19.9% over the same period last year (the same period last year in 2021 equaling 74% and down 7.7%).
The foreign direct investment from the beginning of the year to 20th November 2022 including newly registered capital, adjust registered capital, and the total value of capital contribution and share purchases of foreign investors reached nearly 25.14 billion USD, decreased by 5% compared to the same period in 2021.
Among 72 countries and territories having newly licensed investment projects to Vietnam in 11 months in 2022, Japan was the largest investor with 3.23 billion USD, accounting for 28.1% of total newly registered capital; following was Singapore with 1.97 billion USD, accounting for 17.1%; Denmark 1.32 billion USD, accounting for 11.5%; China 1.29 billion USD, accounting for 11.2%; Korea 930.8 million USD, accounting for 8.1%; Hong Kong (China) million USD, accounting for 8%.
There are myriad reasons to be optimistic about continued strong value growth in trade, and retails
Trade and consumer services activities were more active in this year, so the total retail sales of consumer goods and services in YTD November 2022 increased by 17.5% compared to the same period last year.
Certainly, continued economic growth is one of them. In line with this, the trade agreements the government entered into with the EU and ASEAN has been creating stronger economic and cultural ties between Vietnam and other countries around the world. Intensified competition across the market resulting from these trade movements can only benefit the Vietnamese business, as it will motivate both established players and new entrants to focus harder on innovation, marketing and pricing strategies in order to sustain and/or gain a greater market share.
Generally, in 11 months of 2022, the export turnover was estimated at 342.21 billion USD, rose by 13.4% over the same period in 2021, of which, the domestic economic sector was 87.46 billion USD, went up 10.1%, accounting for 25.6% of total export turnover; the FDI sector (including crude oil) attained 254.75 billion USD, increased by 14.6%, sharing 74.4%.
In 11 months of 2022, there were 35 products with an export turnover of over 1 billion USD, contributing 93.7% to the total export turnover (08 products with export turnover of over 10 billion USD, accounting for 70.1%).
Regarding the structure of export products in 11 months of 2022, fuel and mineral products accounted for 1.4%, up 0.2 percentage points over the same period last year; processed industrial products accounted for 89%, equal to the same period last year; agricultural and forestry products accounted for 6.6%, down 0.5 percentage point; aquatic products accounted for 3%, up 0.3 percentage points.
2 digit industries increased sharply shows highly prospect for equipment and machinery business
Production index for 11 months of 2022 of some 2 digit industries increased sharply compared to the same period last year: Manufacture of beverages (31%); Manufacture of pharmaceuticals, medicinal chemical and botanical products (18.8%); Manufacture of wood and of products of wood and cork (18.4%); manufacture of leather and related products (16.7%); Manufacture of wearing apparel (16.4%); production of machinery and equipment n.c.e (16.2%); Manufacture of other transport equipment (12.7%); Waste collection, treatment and disposal activities; materials recovery (11.3%); Manufacture of electrical equipment (10.4%); Manufacture of paper and paper products (10.3%). In the opposite direction, the IIP index of some industries decreased: Manufacture of basic metals (-2.6%); Manufacture of rubber and plastics products (-7%).
3 - Market sizes and Sales performance


4 – Market share and Competitive landscape
In a highly competitive market, the top 5 players contribute only 22% market size. There are more than 100 brands enter the market.
5 – Detailed analysis on product category
5.1 – Analysis on loadcell product
5.2 – Analysis on Bench Portable Scale product
5.3 – Analysis on Weighing System product
5.4 – Analysis on Checkweigher product
5.5 - Analysis on Health Scale product
5.6 - Analysis on Indicator
5.7 - Analysis on Retail Scale
5.8 - Analysis on Compact Scale
5.9 - Analysis on Truck Scale
6 – Detailed analysis on key brands
6.1 METTLER-TOLEDO
6.2 KELI
6.3 ISHIDA
6.4 CAS
6.5 DIGI & TERAOKA DIGI
7 – Annex
Data table in excel file


